
Creating reports on each and every metric on a daily, monthly, or yearly basis is really tiresome, but have you ever thought about why all shouldn’t be in a single report? Don’t worry, it’s possible with Google Data Studio (GDS) and even allows you to design customized and beautiful reports.
What is Google Data Studio?
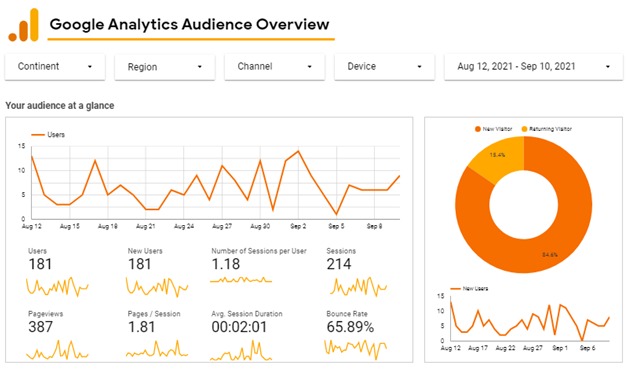
Google Data Studio is a free data visualization tool with a custom dashboard. This data dash boarding allows you to create interactive charts and graphs to visualize the blending data of 1 or more data sources at a time. It helps transforms your data into configurable dashboards and reports that are insightful, easy to read and share.
With Google Data Studio, it’s easy to see what’s working in your company, gain insights into how you can improve, and create real-time dashboards for team members to follow. Here are some things you can use it for: see how well your marketing is doing; get a sense of how many updates people really like; analyze who is driving more traffic on your website; and make more informed decisions with data at every step.
Data Sources to Fetch Data:
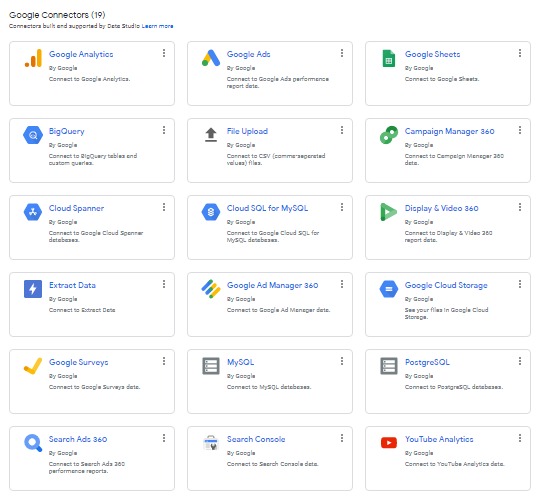
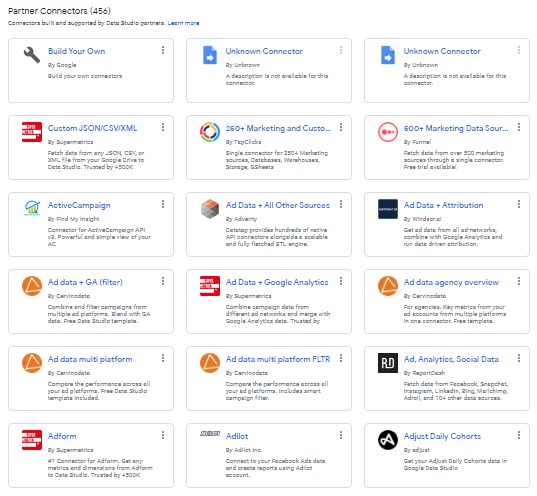
There are 2 types of data sources i.e., Google Connectors(19) and Partner Connectors (456)that are built and supported by Data Studio. All these data sources are used to fetch data to easily bring your data analysis together, create compelling visualizations, and share insights with your team. Some of these are free to integrate and some are paid.
Google Connectors
Partners Connectors
Google Data Studio’s Advantages
Data Studio or Data Dashboarding is more helpful beyond your imagination. Without programming, within just a few minutes, you can build reports from scratch or customize existing reports. It has unlimited features that help sync with all metrics like cities, countries, date range (from days to months to years), devices, browsers, and many more.
- Access to over 220 connectors (free access) and real-time data.
- Easily connect to a variety of data sources such as Google Analytics, Search Console, Google Ads, Spreadsheets, Google BigQuery, etc.
- Easy to collaborate and share reports with team members.
- Complete control over the report and its visuals, including the ability to add as many pages or charts as desired.
- Built-in sample reports to speed up the report creation process.
- Charts and tables with a wide range of filters/options can let you visualize your data.
- No cod is required to transform your raw data of various data sources into the metrics and dimensions to produce custom reports and dashboards.
- By distributing automatic data dashboards that refresh on a regular basis, you can support individuals with knowledge of your KPIs.
You have the option of presenting the data in a variety of ways, including bar graphs, charts, and line graphs. Also, can choose various colors, fonts, layout designs, and many more as per your logo design or business requirements.
How to Access Data Dashboarding?
Data Dashboarding is surely a time-saving tool for business owners but needs some effort to learn how to access it. The total process is actually as simple as 3 steps, which are Connect, Visualize and Share.
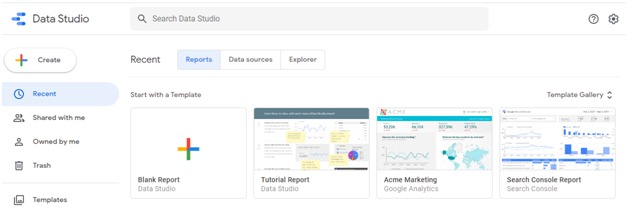
- Visit and login to Google Data Studio.
- Connect your data sources by clicking on the “Create” option then “Data Sources” to find the list of Google Connectors and Partner Connectors, a total of 475 connectors built and supported by Data Studio.
- Authorize your selected connector to integrate and fetch the required data.
- Create a report by clicking on the “Create” option to find “Report” or visit “Template Gallery” to find the built-in sample reports category-wise.
- Add some charts, tables, graphs, or texts to customize the format, title, and captions.
- Add date range, metrics, and dimensions to display the required values.
- See the preview of the report before sharing, to find whether it requires any edits or not.
- Share the report and you can also minimize the access of other team members.
Data visualization with Google Data Studio is most preferable to visualize the entire data in one place and get insights from it. If you need assistance in generating an interactive dashboard with custom reports, visit Devgraphix. Our professionals help you create amazing data visualizations in your business very quickly and easily at a much affordable price.
Get in touch with us to learn more about Google Data Studio.